Resource
Écrit par PETAZZI Catherine, Gestionnaire PC2, PC3, Masters Vendredi, 06 Mars 2015 08:37 La répartition des étudiants pour les examens du C2i - 2ème semestre 2014-2015 est affichée. Écrit par PETAZZI Catherine, Gestionnaire PC2, PC3, Masters Mercredi, 18 Février 2015 11:48 Demande de transfert (départ et arrivée) : dépôt au bureau de la scolarité : du 2 mars au 20 avril 2015 inclus- Dossier "départ" : lettre de motivation et pièces justificatives pouvant appuyer la demande ainsi que l'accord écrit de l'université d'accueil- Dossier "arrivée" : lettre de motivation accord écrit de l'université d'origine en vue de l'inscription à l'université de bourgogne Écrit par PETAZZI Catherine, Gestionnaire PC2, PC3, Masters Vendredi, 23 Janvier 2015 10:54 En raison des examens de l'UFR Pharmacie, le cours du vendredi 23 janvier 2015 est reporté au vendredi 20 mars 2015, même heure, même salle. Écrit par PETAZZI Catherine, Gestionnaire PC2, PC3, Masters Lundi, 12 Janvier 2015 08:43 Le cours de l'UE 12 Hormonologie et reproductiton du mercredi 14 janvier 2015 se déroulera à 16h comme prévu initialement Mise à jour le Jeudi, 08 Janvier 2015 16:33 Écrit par PETAZZI Catherine, cialis www.cialisgeneriquefr24.com Gestionnaire PC2, PC3, Masters Jeudi, 08 Janvier 2015 16:28 Le cours de l'UE "revêtement cutané" du mercredi 14 janvier 2015 de 14h à 16h est annulé et reporté au vendredi 16 janvier de 17h à 19h - Amphi courtois Mise à jour le Mardi, 16 Décembre 2014 16:26 Écrit par Lena PERTUY, PC2, PC3, Masters Mardi, 16 Décembre 2014 16:21 Au vu de l'imbroglio causé par la diffusion des notes des contrôles continus, les règles concernant tant les réclamations que la notation sont clairement établies dans le document ci-dessous. Mercredi de 13h30 à 17h00.
Using Data Visualisations to Support Data Investigations

When working with data, data visualisation techniques can be used in two different ways: - for analysing or making sense of a dataset (visual analysis); - for communicating some particular aspect of the data story (visual presentation).
By Tony Hirst from the Open Knowledge Foundation
When used for presentation purposes, we also need to distinguish between data visualisations and infographics. Whilst in general terms infographics do provide a way of representing data using eye-capturing graphics, there is often only an arbitrary relationship between data values and the visual dimensions that represent them.
In contrast, data visualisations take a more exact approach when it comes to how the data is visually represented, with careful decisions made about the selection of axes limits and scales for use in line charts or bar charts, for example, or the positioning or sizing of nodes in a network map. As a result, we can see how data visualisation can be used for analysis - the well-defined relationship between data values and visual variables allows us to literally "look at" our data in order to make sense of it and look for interesting features within it, features that may be hidden by summary statistics. For example, the summary statistics (mean values, variances, correlation) for the following sets of numbers - known as Anscombe's quartet - are the same across each data set, but when viewed on a scatterplot, we can see how the data behaves very differently.

In the first (top left) case we appear to have a typical "noisy" trend upwards in the data; in the second (top right) case we have a series of values that increase and then decrease in a smooth curve. The bottom left dataset shows a very strong linear tend with a pronounced outlier - maybe some mistake in the data? - with the bottom right chart also demonstrating an outlier - although in this case it might represent the start of another vertical grouping (for example, a change in behaviour may occur for values of y greater than 10. For some datasets, there are natural ways of representing the data. For example, datasets that have a geographical component might usefully be represented as markers on a map, or calendar dates or ranges might reveal interesting patterns, such as a breaks, or overlaps, when displayed on a timeline.

The OKF timeliner toolkit provides an easy way of producing connected timeline and map view from data contained in a Google spreadsheet. The MIT/Simile project Timemap also allows you to view data contained in a Google spreadsheet on connected map and timeline view. CartoDB provides a powerful online environment for generating your own maps.
Differently coloured or differently sized symbols may be used to represent different quantities by geographical location, although care needs to be taken to ensure that such depictions just do not follow population distributions.

http://xkcd.com/1138/
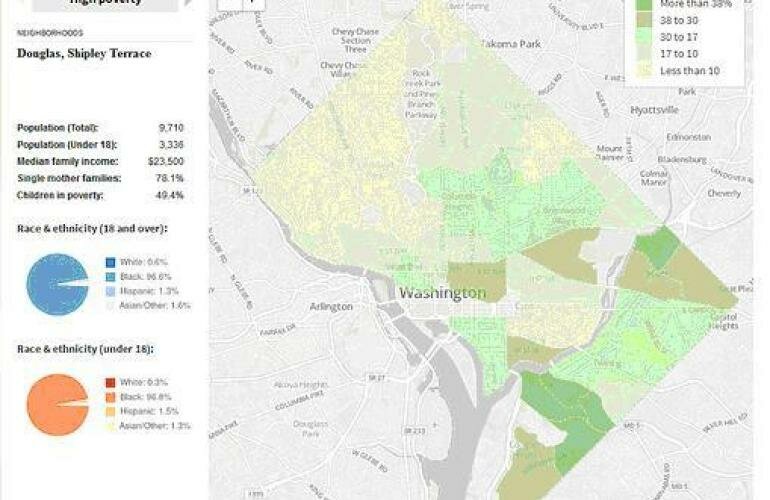
If you have access to boundary data files, regions can be shaded according to numerical quantities associated with the region using choropleth maps, as in this example of Mapping the Well-Being of Children in the District of Columbia
Visual analysis can also provide insights about repeating patterns that occur in time series data. For example, seasonal subseries plots, or cycle plots, reveal not only patterns of behaviour across days of the week, for example, but also for a particular day over a series of weeks or months, as described in this Introduction to Cycle Plots.

Whilst pie charts may be used to look at how "a whole" can be split into different parts - for example, how a budget can be apportioned to different distinct spending areas - a more powerful form of chart known as a treemap can be used to represent the same information in a more intuitive way, as demonstrated on OpenSpending.org.

Treemap representations may also support nested views over a whole dataset, treating each area of the treemap as a treemap in its own right. For example, a treemap over spending areas, might break down each spending area into individual projects or budgets within that spending area. With a little bit of creative thinking, treemap style representations may also be used to explore organisational structures. For example, we might depict the committees operating within a parliament by highlighting the size of each committee based on the number of committee members, and breaking down the membership of each committee according to party affiliations of the members. Or within a local council area, we might depict how votes were cast for each candidate, coloured by party, within each electoral division.

For analysing the relationships between people or things, network visualisations provide a view over the data that shows not only how independent elements connect to each other, but also how they are grouped based on how well connected they are to each other.

Key things to look for in netwrok visualisation are nodes that have a large number of connections to other nodes, or nodes that act as bridges between distinct groups of otherwise highly connected nodes. Interactive network visualisation applications such as Gephi or the NodeXL spreadsheet application provide tools for running network statistics and then visualising the results. Flows between organisations can also be represented visually, as this example of a Sankey diagram representing spend from several councils with members of a particular corporate grouping shows.

In this case, we might look to see how money flows, for example, become concentrated, or whether there are "unusual" pathways that the money might flow along. As you have seen, visual analysis can provide us with a powerful range of tools for visualising a data set in a way that then allows us to start asking questions of it, and start getting answers back, in a graphical way. Whilst some of the charts may be too complex to use for presentation purposes, they may still be of great use to investigators as part of the investigative process.
Photo in this article was published by JD Hancock on FLICKR under a CC BY 2.0 License
Date
Topic
Powered By
In partnership with